Service graphs
|
|
|
|
Graph Information
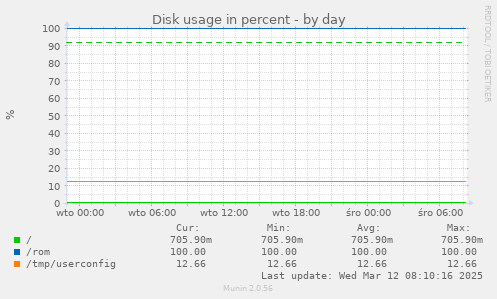
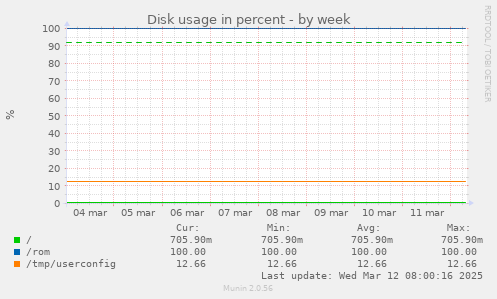
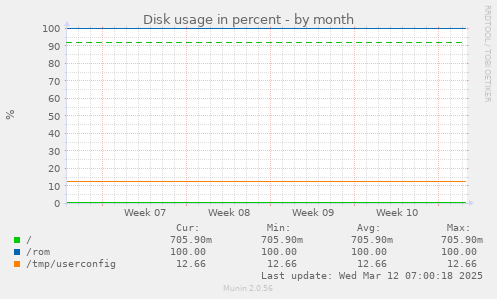
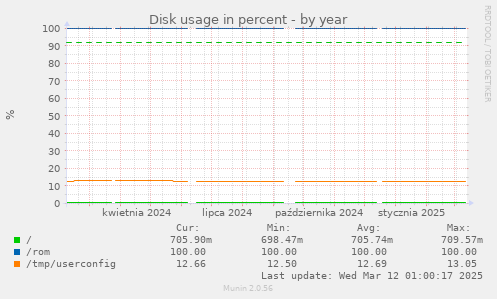
This graph shows partition usage in percent.
Note: This service is in CRITICAL state because one of the values reported is outside the allowed range. Please see further down for information about the ranges and the graph for the values.
| Field | Internal name | Type | Warn | Crit | Info |
|---|---|---|---|---|---|
| / | p_ | gauge | 92 | 98 | Usage for / |
| /rom | p_rom | gauge | 92 | 98 |
Usage for /rom |
| /tmp/userconfig | p_tmp_userconfig | gauge | 92 | 98 | Usage for /tmp/userconfig |